


The words ‘company’ and ‘stock’ are often used interchangeably to mean the same thing. However, a little consideration reveals that they are of course different. The company represents an economic engine and is a legal entity designed to produce goods or services. A stock represents a share of ownership in the company and is a proportionate claim over its assets and earnings. When valuing companies, we are taught that the share price, all else equal, ought to reflect the per unit discounted future cash flows of that business. However, the reality is seldom so straightforward and there are a variety of other things, far beyond the fundamentals of the business itself, that influence the price of the stock. These factors can create significant short-term fluctuations as the different forces interact.
In many ways the stock is like the day-to-day weather. It is highly changeable and can fluctuate dramatically from one day to the next, based on a complex interplay of atmospheric conditions and phenomena. The business is more like the seasons. Although it is of course impacted by the same things, the pattern is much more predictable and changes in this pattern happen slowly. Often, the weather and the season line up. Days are generally cold in the winter and beaches full in the summertime. But sometimes, they do not. In Denver, Colorado on the 12th of June 1947, locals found themselves grabbing snow shovels to clear their driveways after unexpected overnight snow.
The stock market experiences unlikely events frequently and in the midst of a steep market selloff it can be difficult to remember that the situation is most likely temporary. But as investors, it is exactly our job to hold our nerve and wait patiently for the inevitable recovery.
Convince Me
Conviction is more than just a strong opinion or belief, as typically defined. Its true test comes not when market trends align with your strategy, but precisely when they do not. Our conviction in our investment philosophy is built on a well-founded belief that a Quality Growth approach is effective. This belief is grounded in several key ideas:
- Fundamental Drivers: The cornerstone of our belief is the well-established concept that earnings are the primary drivers of share prices. While the market may be swayed in the short term by investor sentiment, it is the long-term economic fundamentals and growth potential of each business that ultimately dictates the price of its stock.
- The Sustainability of High-Quality Companies: We are convinced that high-quality companies—those equipped with robust tools to stave off competition and capable of adapting to change—stand a better chance of maintaining cash flows for extended periods.
- Empirical Support: We have a healthy body of evidence supporting the effectiveness of this investment style, from strong long-term performance1 to the resilience of Quality Growth businesses1.
These principles form the foundation of our strategy, reinforcing our conviction and guiding our actions through market fluctuations.
To effectively implement our principles, consistency in our approach is essential. Switching between investment styles can lead to errors and while a consistent approach does not eliminate all mistakes, it does channel them into areas where we believe we have greater agency, such as forecasting business growth, rather than into unpredictable ones like market timing or stylistic shifts.
To sharpen our conviction, we spend a great deal of time measuring what is and what is not quality growth. This work informs our stock selection and gives us the confidence to hold companies whose stock falls precipitously, as well as the confidence to ignore companies whose stock benefits from momentum. Both cases will naturally cause us to suffer relatively but we expect our emphasis on selecting high quality companies and the transmission mechanism of earnings to share prices to justify our decisions as the time frame lengthens. Moreover, when a stock falls but the fundamentals remain the same, the expected return increases. With careful research we often add to our so-called worst performers in the knowledge that the stock market will correct its errors over time.
Long-term averages, short-term extremes
But how often do we actually see stock prices deviate from fundamentals? Here averages hide a lot. Excessive optimism or pessimism can take the market to extremes and a long way from the averages, far more frequently than the business fundamentals change. This is something that is borne out in the statistics.
The average monthly total return is 0.8 per cent for the companies in the S&P 500 index but 76.7 per cent of discrete monthly returns fall outside of +/- 1 per cent of this mean. In other words, if we return to our elementary mathematics days of selecting red and white balls from jars, three out of every four times we put our hand in the monthly S&P 500 jar, we will pick a ball with a value greater than 1.8 per cent or less than -0.2 per cent.
Knowing that the whole market operates in this unpredictable way helps to arm the investor with important information. But while this may be true in aggregate, surely excellent businesses have more investors engaging in price discovery and as a result see less stock price volatility?
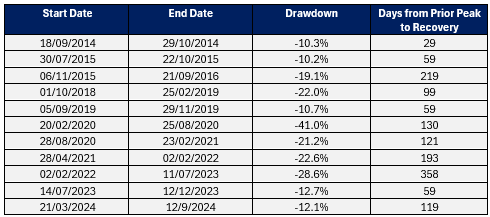
Not necessarily. We have found that even some of the best companies in the world still experience a great degree of volatility. To illustrate this with an example, the largest position in Seilern World Growth is MasterCard, a position that has featured in the top ten of Seilern World Growth for almost 15 years2. Its business merits have been well tested by competition and by various regulators, it has some of the highest level of forecastability in our Seilern Universe3 and is well-regarded as one of the quintessential examples of a Quality Growth business.
As the table below shows, even the quintessential example of a Quality Growth business has had quite the ride, seeing drawdowns of greater than -10 per cent on eleven separate occasions over the last ten years:
Table 1: MasterCard Drawdowns
What is the investor to do? The answer is to pick from a different jar. As my colleague Quentin has illustrated, the longer that you can extend your holding period, the greater the likelihood that the jar only contains positive values in the first place.
A key ingredient of holding over long periods is our ability to weather this volatility thanks to our deep research and our faith in our process. This is important as this drawdown story is not isolated to MasterCard. Each year across Seilern World Growth a number of stocks fall by this same magnitude and more (see Figure 1). Over the last ten years, almost every single stock in our funds, at some stage during the year falls -10 per cent from peak to trough. The frequency is equally as shocking for stocks that experience peak-to-trough falls of -20 per cent or more. On average, half of the portfolio will experience a -20 per cent drawdown during the year.
Figure 1: Number of Stocks Falling Each Year (Seilern World Growth)
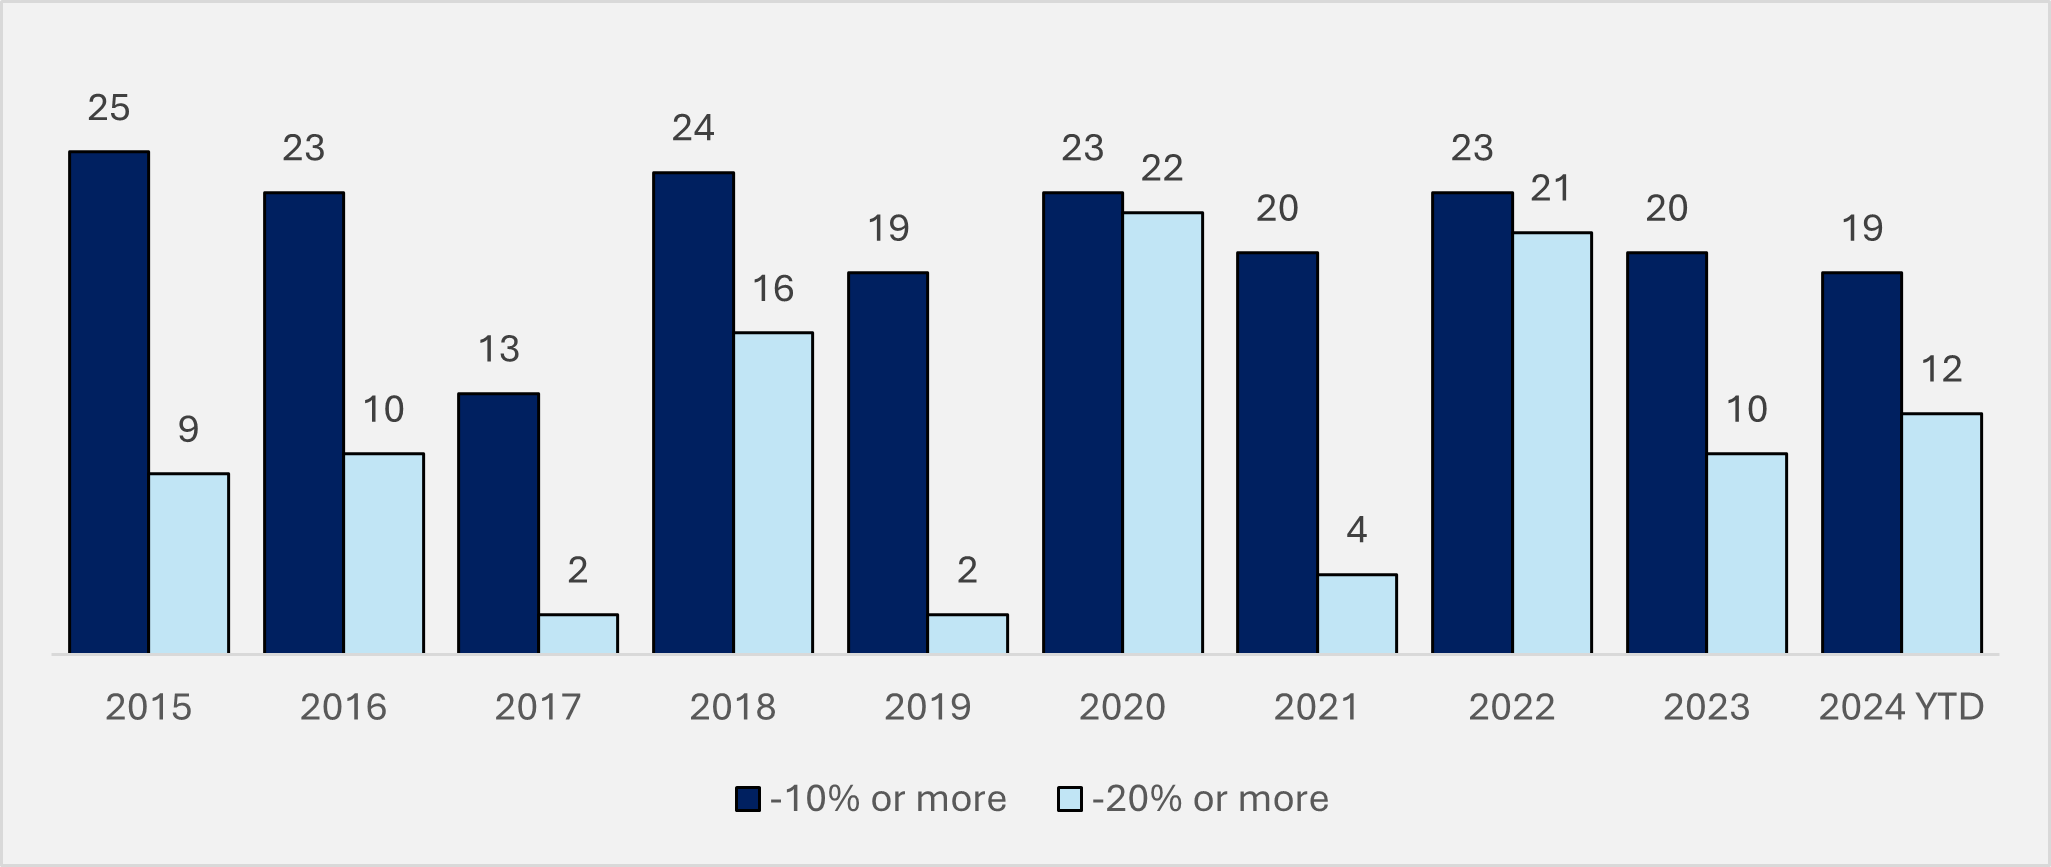
But does this matter? Rather than viewing these drawdowns over the last ten years as a cause for concern, the investor can view them as they mostly are – a representation of the fickle and changeable views of the market that can be safely ignored or better still, as an opportunity to take advantage of. Moreover, although these drawdowns are remarkably common, over time the knot undoes itself and most stock prices recover; the annualised growth rate for Seilern World Growth’s net asset value over the same ten years has been 12.5 per cent4, a return achieved with minimal fund turnover.
The stock market, like the weather is prone to prompt activity. Perhaps investors would be better to sit back and take stock before they act. Just as one snowflake does not make a winter and one correction does not spell a bear market, things are rarely as bad (or as good) as they seem on first take. Residents of Denver know this well. A mere four days after the snowfall, the temperature returned to a summery 31 degrees.
MJ Faherty,
1 October 2024
- Quality Growth, as exemplified by the performance of the Seilern funds, has generated since inception annualised returns as at 30th September 2024 that range from 11.18 per cent (Seilern Europa EUR U R Founders, 16 October 2009) to 9.92 per cent (Seilern World Growth USD U I, 5 July 2006) and 9.98 per cent (Seilern America USD U I, 10 July 2007). ↩︎
- Although Quality Growth companies are not immune to market selloffs and tend to experience declines alongside the market, they have typically recovered 1.8x faster than the broader market over the last ten years (Standard & Poor’s, Seilern Investment Management Ltd. as at 30 September 2024). ↩︎
- The position was initiated in 3Q2009 and entered the top ten in 1Q2010. ↩︎
- Objectively measured by the dispersion of sell-side estimates of revenue and earnings. ↩︎
- This is for the USD U I share class as 30 September 2024. This was ahead of the benchmark, the MSCI World by 2.4 per cent. ↩︎
This is a marketing communication / financial promotion that is intended for information purposes only. Any forecasts, opinions, goals, strategies, outlooks and or estimates and expectations or other non-historical commentary contained herein or expressed in this document are based on current forecasts, opinions and or estimates and expectations only, and are considered “forward looking statements”. Forward-looking statements are subject to risks and uncertainties that may cause actual future results to be different from expectations.
Nothing contained herein is a recommendation or an offer or solicitation for the purchase or sale of any financial instrument. The material is not intended to provide, and should not be relied on for, accounting, legal or tax advice, or investment advice. The content and any data services and information available from public sources used in the creation of this communication are believed to be reliable but no assurances or warranties are given. No responsibility or liability shall be accepted for amending, correcting, or updating any information contained herein.
Please be aware that past performance should not be seen as an indication of future performance. The value of any investments and or financial instruments included in this website and the income derived from them may fluctuate and investors may not receive back the amount originally invested. In addition, currency movements may also cause the value of investments to rise or fall.
This content is not intended for use by U.S. Persons. It may be used by branches or agencies of banks or insurance companies organised and/or regulated under U.S. federal or state law, acting on behalf of or distributing to non-U.S. Persons. This material must not be further distributed to clients of such branches or agencies or to the general public.
Get the latest insights & events direct to your inbox
"*" indicates required fields