


Active managers have had a tough year, mainly because their performance has been determined largely by whether or not they’ve owned one stock in particular. Depending on the magnitude of underperformance, if you are an investor or asset allocator, you may be asking whether you would be better off simply buying a passively-managed, index-matching exchange traded fund (ETF).
In this newsletter, we discuss what we see as the perils of investing in ETFs and how this fundamentally differs to Quality Growth investing. While investing in the index offers the performance of “the market”, it exposes investors to unstable and changing risks, while at the same time lacking the risk management function that active investing provides. In the case of Quality Growth investing, this is the repeated application of our process-driven investment framework, so our investors know that we will remain consistent to our style of investing, irrespective of whether or not it is in favour with the market.
The Vices of Indices
Even though “benchmark” and “index” are distinct concepts, increasingly (as in the case of broad market indices such as the S&P 500 or the MSCI All-World), the index is the benchmark and vice versa. This has coincided with the rise of passive ETFs, which give investors tremendous flexibility to trade and invest in particular indices at lower costs than actively managed funds. For those who are so inclined, it can allow investors to follow buy-and-hold strategies that mimic a particular index, thereby giving them access to the performance of the market through lower-cost vehicles.
However, investing in such vehicles is not without risk. The fundamental fallacy of index investing is that by owning the market, it is seen as being the neutral or average position and therefore viewed as risk-free. We think this is flawed for two key reasons.
First, indices are not a stable measure of risk. If we take for example the S&P 500, it is an index of the largest 500 publicly listed US companies by market capitalisation.1 While the criteria for a company to be included in the S&P 500 has been consistent over time,2 the companies that meet these criteria can change on a quarterly basis. As a result, the underlying composition of the index changes over time, and this can lead to the concentration of risks in a small number of companies or sectors.
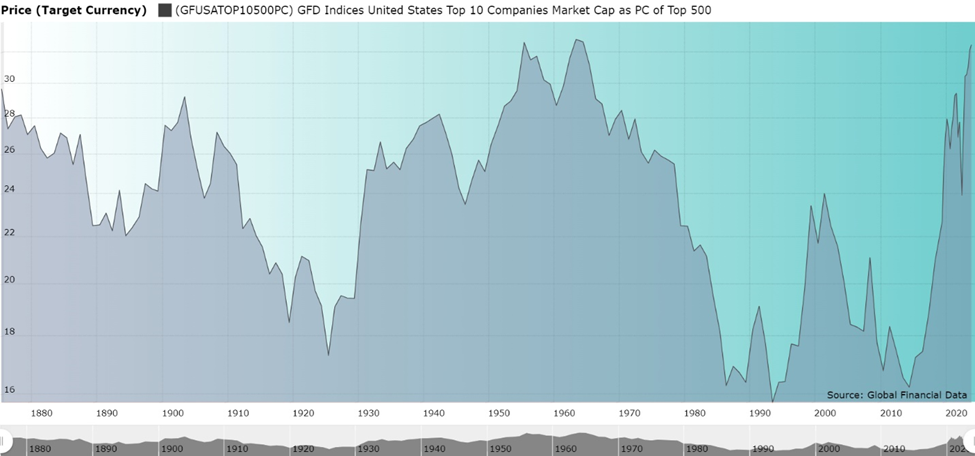
One of the defining characteristics of the current market environment is the extent to which a few companies are dominating the top of the leaderboard. Today, the 10 largest US companies account for 35.4 per cent of the S&P 500 index3 – a degree of concentration we have only seen twice before and the last time was over fifty years ago (see Figure 1).4
Figure 1: Top 10 Companies as a Percentage of the Top 500 US Companies, 1875 to 2024
Throughout history, there have always been market champions; examples have included the railroad monopolies of the 1900s to the 1930s (Penn Central, Union Pacific, New York Central, etc.), the Oil conglomerates of the 1900s (Exxon, Mobil, Chevron, Marathon, etc.), and the Auto champions of the 1920s to the 1960s (General Motors, Ford, and Chrysler).5 These companies have stayed at the top for different timeframes but, importantly, as they grew to represent a large share of the index, they brought their own suite of business risks, which were different from the ones that existed before.
In the last two decades, companies in the Information Technology (IT) sector have dominated this market leadership. The dot-com bubble showed how markets can be too exuberant when they started to anticipate future earnings growth that was not backed by fundamentals. By 1999, the sector had risen to 29.2 per cent of the index, but by the end of 2002 its weighting had halved.6 Their more recent ascension in market share has been largely driven by expanding earnings, underpinned by optimism surrounding artificial intelligence (AI). This has caused the narrowest market in recent history, with the sector eclipsing the dot-com peak at 31.4 per cent of the index today.7
There are a number of reasons why today’s IT market leaders could stay at the top and continue to outperform. However, we remain wary and find the low earnings predictability and forecastability of the industry the key reasons why we don’t invest in these semiconductor companies, as we discussed in last month’s newsletter (Do you Hold Nvidia?).
AI may well underpin the next wave of economic growth, but for those who are unable to adapt, it may render their services less useful, just like railroads after the invention of the car or landlines with the introduction of mobile networks. Other risks include the looming possibility of antitrust regulation, threatening a breakup like that of Standard Oil. At one time, IBM’s dominance also looked insurmountable. Today, it accounts for less than 0.4 per cent of US-listed companies by market capitalisation and less than 1.1 per cent of all IT firms, the sector that accounts for the bulk of the index today.8
All this is to demonstrate that the risk profile of the index is not stable. For an asset allocator whose purpose is to produce consistent, risk-adjusted returns over time, it makes this task increasingly difficult.
Risky Business?
This periodic concentration highlights the second key reason why indices should not be seen as risk-free: there is no portfolio construction mechanism to protect investors from the inevitable crashes that tend to follow such concentration.
In the absence of any risk management framework, investors end up increasingly allocated to the previous outperformers because position sizes are managed according to their market capitalisation, and companies whose share prices rise the most become a bigger share of the index. This is an important point and means that position sizing ignores company-specific risks in the index as well as other considerations, notably valuation. Momentum can exacerbate these moves, creating feedback loops whereby rallies in companies can incite further rallies in those same companies, which draws more capital into the index, amplifying the risk, until suddenly, it reverses. As a result, investing in the index does not protect investors from drawdowns. If anything, it can work in exactly the opposite way – over-exposing the investor to momentum on the way up, and on the way down.
Concentration is not, in and of itself, a bad thing when paired with a risk management framework (The Myth of Sector Allocation). However, unlike active management, which intentionally trims these exposures when the risks increase, indices (and passive strategies more generally) lack this important portfolio construction mechanism.9 In addition, the argument that the large number of companies in the index protects the investor, does not hold water – 487 companies in the S&P 500 index have a weight of less than 1 per cent.10
The purpose of this newsletter is not to say that indices as benchmarks or ETFs are right or wrong; it is for each investor to specify their objectives and then to find a solution that best meets these. Rather, its purpose is to highlight that when using a broad-market index as a benchmark, or investing in such an index, you are not making a neutral call. Nor are you making a comparison to a consistent and representative basket of securities with a balanced risk profile. Instead, your starting point is a basket of securities whose underlying risk is higher than meets the eye, which changes as the underlying companies grow and shrink, and where, as the investor, you have little agency to reduce these risks as they grow.
Why We Are Consistent
Quality Growth as an asset class intentionally cuts out companies that do not meet the stringent criteria of our Ten Golden Rules. By requiring all of our companies to meet every one of our Golden Rules, our tolerance for risk is lower than that of the index: we only want to invest in companies that we believe can sustainably grow their earnings over the long term. So we exclude companies where we believe the risk of them achieving that growth is too high or too unpredictable. For example, of the 10 market leaders that make up 35.4 per cent of the S&P 500 index, we deem only two of these companies to currently meet our Quality Growth criteria.11
Not only is the risk lower, but thanks to the disciplined and consistent way we assess risk, it is also much more stable over time. This stability comes foremost from the fact that we only invest in Quality Growth companies, compared to the index where the risks can ebb and flow with the latest momentum trend. Next, it comes from managing these dynamic risks as they develop. Trimming companies as risks grow is an important part of portfolio construction that allows us to balance risk as it evolves.
We are careful not to say that this is the only way to achieve returns while at the same time managing risk. There are many strategies that will try to do this to differing degrees, ranging from high growth to private equity to deep value. Importantly, each will produce different outcomes in different markets. Recognising this allows the investor to build an asset allocation framework but this will only work if each individual philosophy and process is executed in a consistent fashion. The dynamism of indices is, in the eyes of many, one of its key advantages; by definition they will always benefit from the latest trend in the market. However, this dynamism is a sword that cuts both ways and the very same dynamism that gives the investor exposure to the latest trend, also exposes the investor to all of its associated risks.
When it comes to Quality Growth, it is the consistency of our strategy and investment process that is most important, so our investors know exactly what they are investing in and can therefore understand when it works well and when it may not.
1The S&P 500 includes 503 components because three companies have two share classes listed.
2The way the S&P 500 is constructed today has been in place since 1988. Interestingly, when Standard and Poor’s (S&P) introduced the S&P 500 index in March 1957, it included 425 industrial stocks, 15 rail stocks and 60 utility stocks. The S&P 500 maintained this composition until July 1976 when finance stocks were added to the index and it thereafter included 400 industrials, 40 utilities, 40 finance and 20 transport stocks. Allocation by sector was abandoned on 6 April 1988 and today S&P uses GICS sectors with no attempt to allocate stocks by sector: Bryan Taylor, The S&P Composite Before 1957, Global Financial Data (29 August 2018) <https://globalfinancialdata.com/the-sp-composite-before-1957>
3As at 31 July 2024. We use the US market for illustrative purposes, but the critique is similar in international markets. For example, if you purchase the Spanish market index, the IBEX 35, 20.1 per cent of your exposure is to the largest company, Inditex. In Denmark, the problem is even worse, with Novo Nordisk accounting for 74.1 per cent of the OMX Copenhagen 25; Bloomberg.
4Bryan Taylor, S&P Market Concentration Hits a New All-Time High, Global Financial Data (1 July 2024) <https://globalfinancialdata.com/s-p-market-concentration-hits-a-new-all-time-high>
5Bob Prince, Khia Kurtenbach and Thomas Maisonneuve, The Life Cycle of Market Champions, Bridgewater (18 June 2024) <https://www.bridgewater.com/research-and-insights/the-life-cycle-of-market-champions>
6At this point it was overtaken by the Financials sector, as the packaging and repackaging of complex financial derivatives by banks drove the sector to represent the largest share of the index (22.3 per cent) in 2006, which ultimately ended in the global financial crisis; Bloomberg.
7As at 31 July 2024. Four of the top 10 companies are in the information technology sector: Microsoft, Apple, NVIDIA and Broadcom Inc.; Bloomberg.
8Bloomberg. Another way of looking at this is that the average lifespan of a company in the S&P 500 index is now less than 20 years and falling, from an average of 30 years in the 1960s, suggesting that the pace of disruption is increasing: S. Patrick Viguerie, Ned Calder and Brian Hindo, 2021 Corporate Longevity Forecast, Innosight (May 2021) <https://www.innosight.com/wp-content/uploads/2021/05/Innosight_2021-Corporate-Longevity-Forecast.pdf>
9Active strategies can also fall prey to this when managers don’t want to cut their winners.
10As at 31 July 2024, Bloomberg.
11These two companies are Microsoft and Alphabet.
This is a marketing communication / financial promotion that is intended for information purposes only. Any forecasts, opinions, goals, strategies, outlooks and or estimates and expectations or other non-historical commentary contained herein or expressed in this document are based on current forecasts, opinions and or estimates and expectations only, and are considered “forward looking statements”. Forward-looking statements are subject to risks and uncertainties that may cause actual future results to be different from expectations.
Nothing contained herein is a recommendation or an offer or solicitation for the purchase or sale of any financial instrument. The material is not intended to provide, and should not be relied on for, accounting, legal or tax advice, or investment advice. The content and any data services and information available from public sources used in the creation of this communication are believed to be reliable but no assurances or warranties are given. No responsibility or liability shall be accepted for amending, correcting, or updating any information contained herein.
Please be aware that past performance should not be seen as an indication of future performance. The value of any investments and or financial instruments included in this website and the income derived from them may fluctuate and investors may not receive back the amount originally invested. In addition, currency movements may also cause the value of investments to rise or fall.
This content is not intended for use by U.S. Persons. It may be used by branches or agencies of banks or insurance companies organised and/or regulated under U.S. federal or state law, acting on behalf of or distributing to non-U.S. Persons. This material must not be further distributed to clients of such branches or agencies or to the general public.
Get the latest insights & events direct to your inbox
"*" indicates required fields