


Like the mythological titan Atlas holding up the Heavens, NVIDIA currently appears to be bearing the heavy weight of the entire US stock market. Indeed, what is becoming apparent is that the fate of an equity fund manager’s performance in 2024 might actually end up being entirely distilled into the above question. The aim of this newsletter is to give some historical context regarding this current market concentration, as well as to delve deeper into the topic of whether the semiconductor industry, as a whole, could ever be investible for a Quality Growth investor.
For those who still don’t fully understand what NVIDIA does, in its simplest form, the company makes powerful computer chips called graphics processing units that help speed up graphics for video games and run complex tasks in areas including artificial intelligence (AI) and data processing. Essentially, its products help computers and other devices perform complex tasks much faster and more efficiently, driving advancements in various tech industries.
A Growth Explosion
NVIDIA’s share price rise has been extraordinary. In the five years from 2018 to 2023 its share price rose by +1,400 per cent, giving it over a +12,000 per cent ten year return, or a compound annual growth rate of +62 per cent. This year alone it has risen a further +150 per cent, momentarily eclipsing Apple and Microsoft to become the world’s most valuable company after adding nearly $2 trillion to its market capitalisation. This is truly a feat for the record books, and one which certainly deserves further analysis.
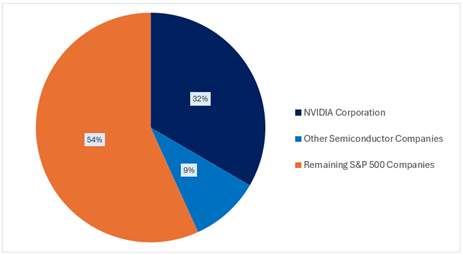
Firstly, we wanted to see how much NVIDIA’s market capitalisation change this year represented of the overall increase in value of the S&P 500. The answer was rather eye-opening: 32 per cent of the total $6 trillion increase in value of the S&P 500 to the end of June 2024 can be attributable to a single company. Whilst many would question the rationality of NVIDIA’s move, perhaps the simplest explanation is that it has seen significant upwards earnings revisions of +30 per cent for 2024, +46 per cent for 2025 and +49 per cent for 2026. In a market which is constantly looking for an AI story, this kind of earnings momentum is sure to capture everyone’s attention.
Looking deeper, one finds that the 20 semiconductor companies which are currently in the S&P 500 have actually contributed a grand total of 41 per cent of its total rise so far in 2024.1 These 20 companies only represented 8 per cent of the S&P 500 index’s weight at the start of the year, so the concentration of the market’s return within a single industry is quite extraordinary.
Chart 1: YTD Market Cap Change as a per cent of S&P 500 Change
A Historical Context
Secondly, we wanted to put NVIDIA’s enormous change this year into some historical context. Below we’ve compiled data going back to 1992 (33 years). The below chart shows the largest company market capitalisation changes in the years when the S&P 500 rose (which has occurred in 24 out of these 33 years). Like we did above, we also show what percentage change this represents of the S&P 500’s change in that specific year (the blue dot).
Chart 2: Largest Annual Company Market Cap Change ($bn) and as per cent of the S&P 500 Change since 1st January 1992 – 30th June 2024.
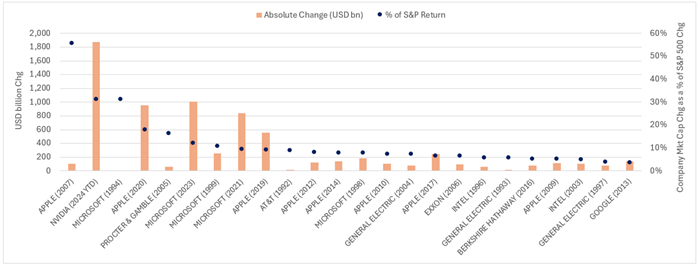
The takeaway here is that we are currently witnessing something quite historical. NVIDIA’s move this year, relative to the S&P 500’s, is the second largest percentage move since 1992. What’s also important to note is that, whilst Apple’s move in 2007 was larger at 56 per cent of the S&P 500’s change, it actually only represented around a $100 billion change. NVIDIA’s $1.9 trillion change this year is therefore quite a noticeable outlier. Perhaps even more interesting is that NVIDIA is now rubbing shoulders with an elite group of companies which have subsequently gone on to change the world. Here I refer to Microsoft spear-heading the revolution of the personal computer in the early 1990s, as well as the launch of Apple’s iPhone in 2007. The eagle-eyed reader will note that Apple and Microsoft appear 13 times on this high-achievers list.
The Challenges For Quality Growth Investors
The obvious question to ask is whether NVIDIA is in the process of also doing something truly world-changing. Unfortunately the answer will not win any business school awards. Who knows! Convincing arguments can certainly be made that we are only at the very early stages of humankind’s journey towards artificial general intelligence, and yes, this could indeed have enormous and far-reaching consequences for almost every facet of our daily lives.2
However, as we have written previously (The Uncertainties Behind AI), speculating about what the distant future may hold is not within the realms of what a Quality Growth investor pursues. The ultimate reason for this is rather simple and grounded in the principle of predictability and forecastability. Of course, there are many other reasons why the semiconductor industry does not adhere to the 10 Golden Rules, including its high earnings cyclicality, its high end-customer concentration risk, and the cost of technological failure and disruption being too high for our liking.3 For the purposes of this newsletter, however, we will focus our attention on the principle of earnings predictability and forecastability.
With this lens, one could say that the current quality of NVIDIA is high in terms of its key fundamentals such as return on capital, margins and debt.4 But how predictable is it that these same qualities will endure over the next 10 years? Yes, NVIDIA’s current growth rates of sales and free cashflows are excellent, but how forecastable is it that the trajectory of these growth rates will not materially surprise us (either up or down)?5 Quality Growth investing is focused primarily on managing the downside risk of ‘getting it wrong’, and does so by significantly narrowing the range of possible outcomes regarding the future quality and growth characteristics of a given company.
Digging Into The Numbers
Here, it’s worth working through the detail. Based on a simple 10-year discounted cash flow model, for NVIDIA’s current share price to reflect its fair value, the company would need to achieve the following over the next decade:
- Grow its sales at a compound rate of +26 per cent,
- Maintain an operating margin above 60 per cent, and
- Grow its free cashflow at an incredible rate of +40 per cent annualised.
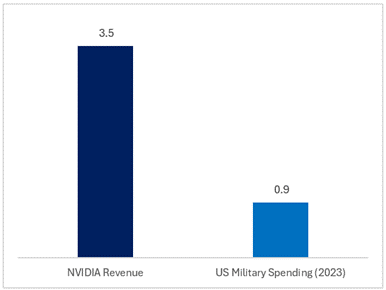
In other words, for NVIDIA’s share price to make any sense today, an investor would have to believe that the company will generate a cumulative $3.5 trillion in revenue over the next decade. To put this into perspective, the US’s total military spending in 2023 was ‘only’ $0.9 trillion, meaning that NVIDIA could pay for 17,500 new fighter jets, more than tripling the current fleet of the US Airforce.6
Chart 3: NVIDIA Est. 10-Year Cumulative Revenue ($trillion)
To put this into a more relevant context, total annual capital expenditures in the US across all sectors of the economy are currently around $8 trillion.7 Assuming these continue growing in line with the 20-year growth trend of +4 per cent per annum implies NVIDIA’s cumulative revenue could therefore represent over 4 per cent of the entire cumulative capital spending in the US over the next 10 years. Whilst that number may not sound large, to have a single company drive even a single per cent of the capital spending in the world’s largest economy is something to take seriously. More importantly, if these big estimates should prove to be even a little wrong, we’re talking about hundreds of billions of dollars of capital spending evaporating.
The Predictability Hurdle
The above points have certainly not been made to convince the reader that these estimates are not achievable. Indeed, we may very well look back in time and realise how grossly conservative they were given the sheer size of the AI growth potential across a multitude of economies and industries. Rather, the key point to make is that these estimates are so large that the range of outcomes for them to become fact are far too wide for a Quality Growth investor to gain adequate comfort. Higher predictability results in a more accurate valuation of a company, which is one of the foundations of being able to manage risk across the portfolio construction process. Crucially, it greatly reduces the risk of a permanent loss of capital. Attempting to forecast a company’s earnings in a year’s time is challenging enough. But attempting to predict how a new and incredibly concept-driven AI industry will evolve (and who will ultimately prevail in terms of share leadership) over the next decade is near impossible. This is within the remit of a pure growth or a power law investor, not a Quality Growth investor (The Company Lifecycle).
Further evidence of the above point can be seen by looking at those same 20 semiconductor companies currently in the S&P 500 (which includes NVIDIA) and analysing the range of outcomes for the market expectations of their earnings over time. Below we have put this time series together, which takes the percentage spread between the highest and lowest earnings estimate on the street at the start of each fiscal year. We have then compared this same range across the c.50 companies currently in the Seilern Universe, for reference.
Chart 4: Spread Between Highest to Lowest Broker Estimates (one year forward)
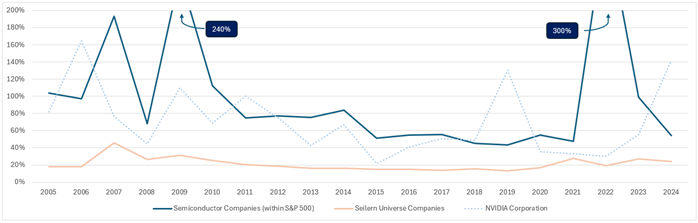
What the above chart clearly demonstrates is that the range of outcomes is structurally much higher for semiconductor companies compared to Quality Growth companies. Now, this might seem obvious given the inherent cyclicality (risk) associated with the boom and bust of the semiconductor industry, however, it’s the magnitude which is worth highlighting here. Since 2005, the semiconductor industry has experienced a nearly 100 per cent difference between the highest and lowest estimate for one-year forward earnings.8 This is 5x wider than the Seilern Universe companies.9 And whilst some may point out that there was a favourable period between 2015-2021 when this range narrowed, as often happens in highly cyclical industries, expectations have once again begun to materially diverge in the last few years given the AI boom. NVIDIA has been described as selling the proverbial shovel during a gold rush, but whether it’s ultimately an AI capex or mining boom is irrelevant – if you’re selling tools, you’re going to suffer when the cycle turns. And this is what makes forecasting growth such a challenge.
Looking specifically at NVIDIA from the last chart, one can conclude that, despite it being by far the largest of all the semiconductor names, its earnings variability is broadly in line with the average semiconductor company with a range of 70 per cent since 2005.10 This is over 3x wider than the 20 per cent achieved across the Seilern Universe companies, which we would argue are also of a high quality, also have high growth rates, yet demonstrate higher predictability and forecastability regarding their future prospects. Not to mention the fact that there is a much higher instance of semiconductor companies missing or exceeding their estimate ranges by a material amount, as has been demonstrated by NVIDIA in only the past couple of years.11 This fact further compounds an already tricky situation of lower visibility into semiconductor companies, throwing into question the ultimate growth rates they can achieve.
Staying the Course
The conclusion to all the issues raised here is not to suggest that Quality Growth investors are more or less able to predict the future. Rather, this is to remind the reader that investing across most of the semiconductor landscape simply does not currently fall within a Quality Growth risk framework, nor has it in the past. Our aim at Seilern is to produce consistent portfolios of Quality Growth businesses, which are equipped to deliver growth through cycles. The probability of achieving this is enhanced by the predictability of these businesses, which gives us a greater degree of certainty around what their real prospects might be.
Whilst this will inevitably lead to periods of underperformance when global mega trends within certain parts of the economy are booming, we remain comforted in the knowledge that our companies still have a high likelihood of being industry leaders over the next 5-10 years, and that they should still be able to compound earnings growth in the low double digit range. Most importantly, they have a higher likelihood of achieving this with much lower earnings variability, as highlighted in Fernando Leon’s last newsletter (Quality Growth: Beyond Boom and Busts). If investors, like us, believe that earnings ultimately drive share prices, and that Quality Growth investors should not be chasing unpredictable trends, then ignoring the noise and staying the course is strongly encouraged at this time.
1 These include Advanced Micro Devices, Analog Devices, Applied Materials, Broadcom, Enphase Energy, First Solar, Intel, KLA, Lam Research, Microchip Technology, Micron, Monolithic Power Systems, NVIDIA, NXP Semiconductors, ON Semiconductor, Qorvo, Qualcomm, Skyworks Solutions, Teradyne, Texas Instruments.
2 If you are feeling particularly dystopian, I would suggest reading this piece by an ex-Open AI employee regarding the (potential) future path of AI.
3 40 per cent of NVIDIA’s sales come from four companies – Microsoft, Meta, Amazon and Google (Absolute Research Strategy).
4 ROIC of 68 per cent, Operating Margin of 54 per cent and Net Debt to EBITDA of -0.5x respectively for the 2023 Financial Year.
5 10-year revenue CAGR of 31 per cent and free cashflow CAGR of 47 per cent
6 The modern fighter jet costs around $200 million. (Lockheed Martin’s F-35 jet is estimated to cost more than $170m: https://www.ft.com/content/aca4f3f0-f9bd-4d96-9928-febb13da6513; )
7 Federal Reserve Bank of St Louis: https://fred.stlouisfed.org/series/BOGZ1FA895050005Q
8 The chart begins in 2009, but this represents the rolling average of the prior 5 years, which starts in 2005.
9 An illustrative example: the Seilern companies have an earnings estimate range of $1.00-1.20 compared to $1.00-2.00 for semiconductor companies.
10 For comparison purposes, Microsoft, a Quality Growth company, has had an 18 per cent range since 2005.
11 https://www.bloomberg.com/news/articles/2024-06-23/nvidia-sales-grow-so-fast-that-wall-street-can-t-keep-up
This is a marketing communication / financial promotion that is intended for information purposes only. Any forecasts, opinions, goals, strategies, outlooks and or estimates and expectations or other non-historical commentary contained herein or expressed in this document are based on current forecasts, opinions and or estimates and expectations only, and are considered “forward looking statements”. Forward-looking statements are subject to risks and uncertainties that may cause actual future results to be different from expectations.
Nothing contained herein is a recommendation or an offer or solicitation for the purchase or sale of any financial instrument. The material is not intended to provide, and should not be relied on for, accounting, legal or tax advice, or investment advice. The content and any data services and information available from public sources used in the creation of this communication are believed to be reliable but no assurances or warranties are given. No responsibility or liability shall be accepted for amending, correcting, or updating any information contained herein.
Please be aware that past performance should not be seen as an indication of future performance. The value of any investments and or financial instruments included in this website and the income derived from them may fluctuate and investors may not receive back the amount originally invested. In addition, currency movements may also cause the value of investments to rise or fall.
This content is not intended for use by U.S. Persons. It may be used by branches or agencies of banks or insurance companies organised and/or regulated under U.S. federal or state law, acting on behalf of or distributing to non-U.S. Persons. This material must not be further distributed to clients of such branches or agencies or to the general public.
Get the latest insights & events direct to your inbox
"*" indicates required fields